Practical Applications of Spreadsheet/Database Software
PART ONE: Spreadsheet and database software would be valuable in the 5th grade science classroom because they foster scientific thinking, classification, and data analysis. This type of program helps students represent information in a clear, graphic way that enhances meaning and motivation. Below are four suggested uses:
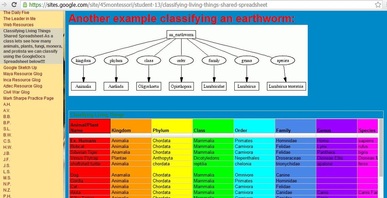
This activity requires students to research unusual animals and label them according to their scientific classification. It's goal is to create an organized and graphically appealing display. Please see activity here: https://sites.google.com/site/45montessori/student-13/classifying-living-things-shared-spreadsheet. This activity allows students to see commonalities and trends among animals. It helps them think critically about what distinguishing feature makes them different from one another, and how "broad" of a difference that is. They can also quantify the frequency of certain classifications. If this activity was completed using database software, students could also sort their information by each category heading as a type of "query".
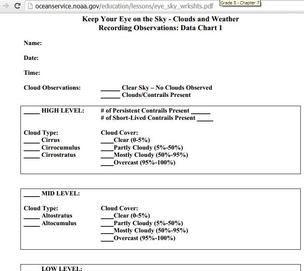
In this activity, from the National Oceanic and Atmospheric Administration, students are responsible for gathering data about clouds and weather in their local area for at least a week (reporting twice daily). Please see activity description here: http://oceanservice.noaa.gov/education/lessons/eye_on_the_sky.html.
After having learned about cloud classification, students will tally types of clouds, position in the sky, direction, and temperature. They are responsible for transforming that raw data into a chart (spreadsheet) that allows for immediate comparison among those categories. They then must look for patterns and relationships in their data. This kind of scientific analysis allows for questions such as:
After having learned about cloud classification, students will tally types of clouds, position in the sky, direction, and temperature. They are responsible for transforming that raw data into a chart (spreadsheet) that allows for immediate comparison among those categories. They then must look for patterns and relationships in their data. This kind of scientific analysis allows for questions such as:
- What fraction/percentage of the sky was covered most often?
- What cloud group did you observe most often?
- When skies were cloudy, were there high, middle or low clouds most often?
- From what direction did clouds come most often?
- What relationship(s) did you notice among the observations that you made? (For example: Low clouds are usually darker gray).
- How can you tell whether clouds might contain water droplets or ice crystals?
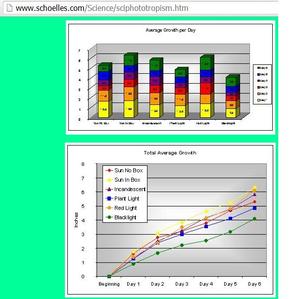
Student groups can collect data on variables that affect plant growth (light, water, food, soil, temperature, etc.) including a control specimen. They can input their daily or weekly quantitative data in a spreadsheet and create a graph that depicts the change over time or that highlights the variance among the results of tested conditions. This picture and idea inspiration comes from a student's Science Fair website: http://www.schoelles.com/Science/sciphototropism.htm. Students would be responsible for electing the type of graph that works best with their data. The chart wizard would guide them through the process of labeling and choosing the axis, which the teacher's assistance as needed.
If desired, the entire class could contribute to a shared spreadsheet file that charted multiple variables at once to determine overall best conditions. Other statistical information could be analyzed such as mean, median, and mode, or percentage. The spreadsheet and graph could be embedded in a formal "lab write-up" or included in a students science investigation blog.
If desired, the entire class could contribute to a shared spreadsheet file that charted multiple variables at once to determine overall best conditions. Other statistical information could be analyzed such as mean, median, and mode, or percentage. The spreadsheet and graph could be embedded in a formal "lab write-up" or included in a students science investigation blog.
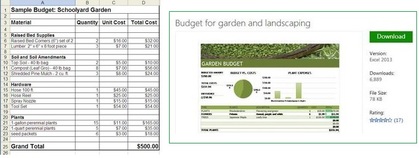
Students create a plan and corresponding budget for a school garden that they will help construct for their science explorations. This planning and development process could look very similar to the one found at Montgomery Country Public Schools: http://www.montgomeryschoolsmd.org/curriculum/outdoored/outreach/garden-how-to.aspx. Students would make connections between math and science as they measure plots, estimate volume, plan for soil and plant varieties, and research costs associated with the materials. Students would be responsible for incorporating formulas for calculations in their spreadsheet cells.
Students would then present their report to a school board or another authentic audience. There are many useful, professional-looking documents to be found here (see picture below): http://office.microsoft.com/en-us/templates/budget-for-garden-and-landscaping-TC104099103.aspx. Learning to work with templates and to manipulate them to accommodate personal project needs is an important skill, and helps young learners create clear, organized, and visually appealing displays of their gathered information.
Students would then present their report to a school board or another authentic audience. There are many useful, professional-looking documents to be found here (see picture below): http://office.microsoft.com/en-us/templates/budget-for-garden-and-landscaping-TC104099103.aspx. Learning to work with templates and to manipulate them to accommodate personal project needs is an important skill, and helps young learners create clear, organized, and visually appealing displays of their gathered information.
PART TWO: Development of a spreadsheet lesson framework for a 5th grade science class (scroll down for description):
The above Google Docs Spreadsheet file can also be found by clicking here.
